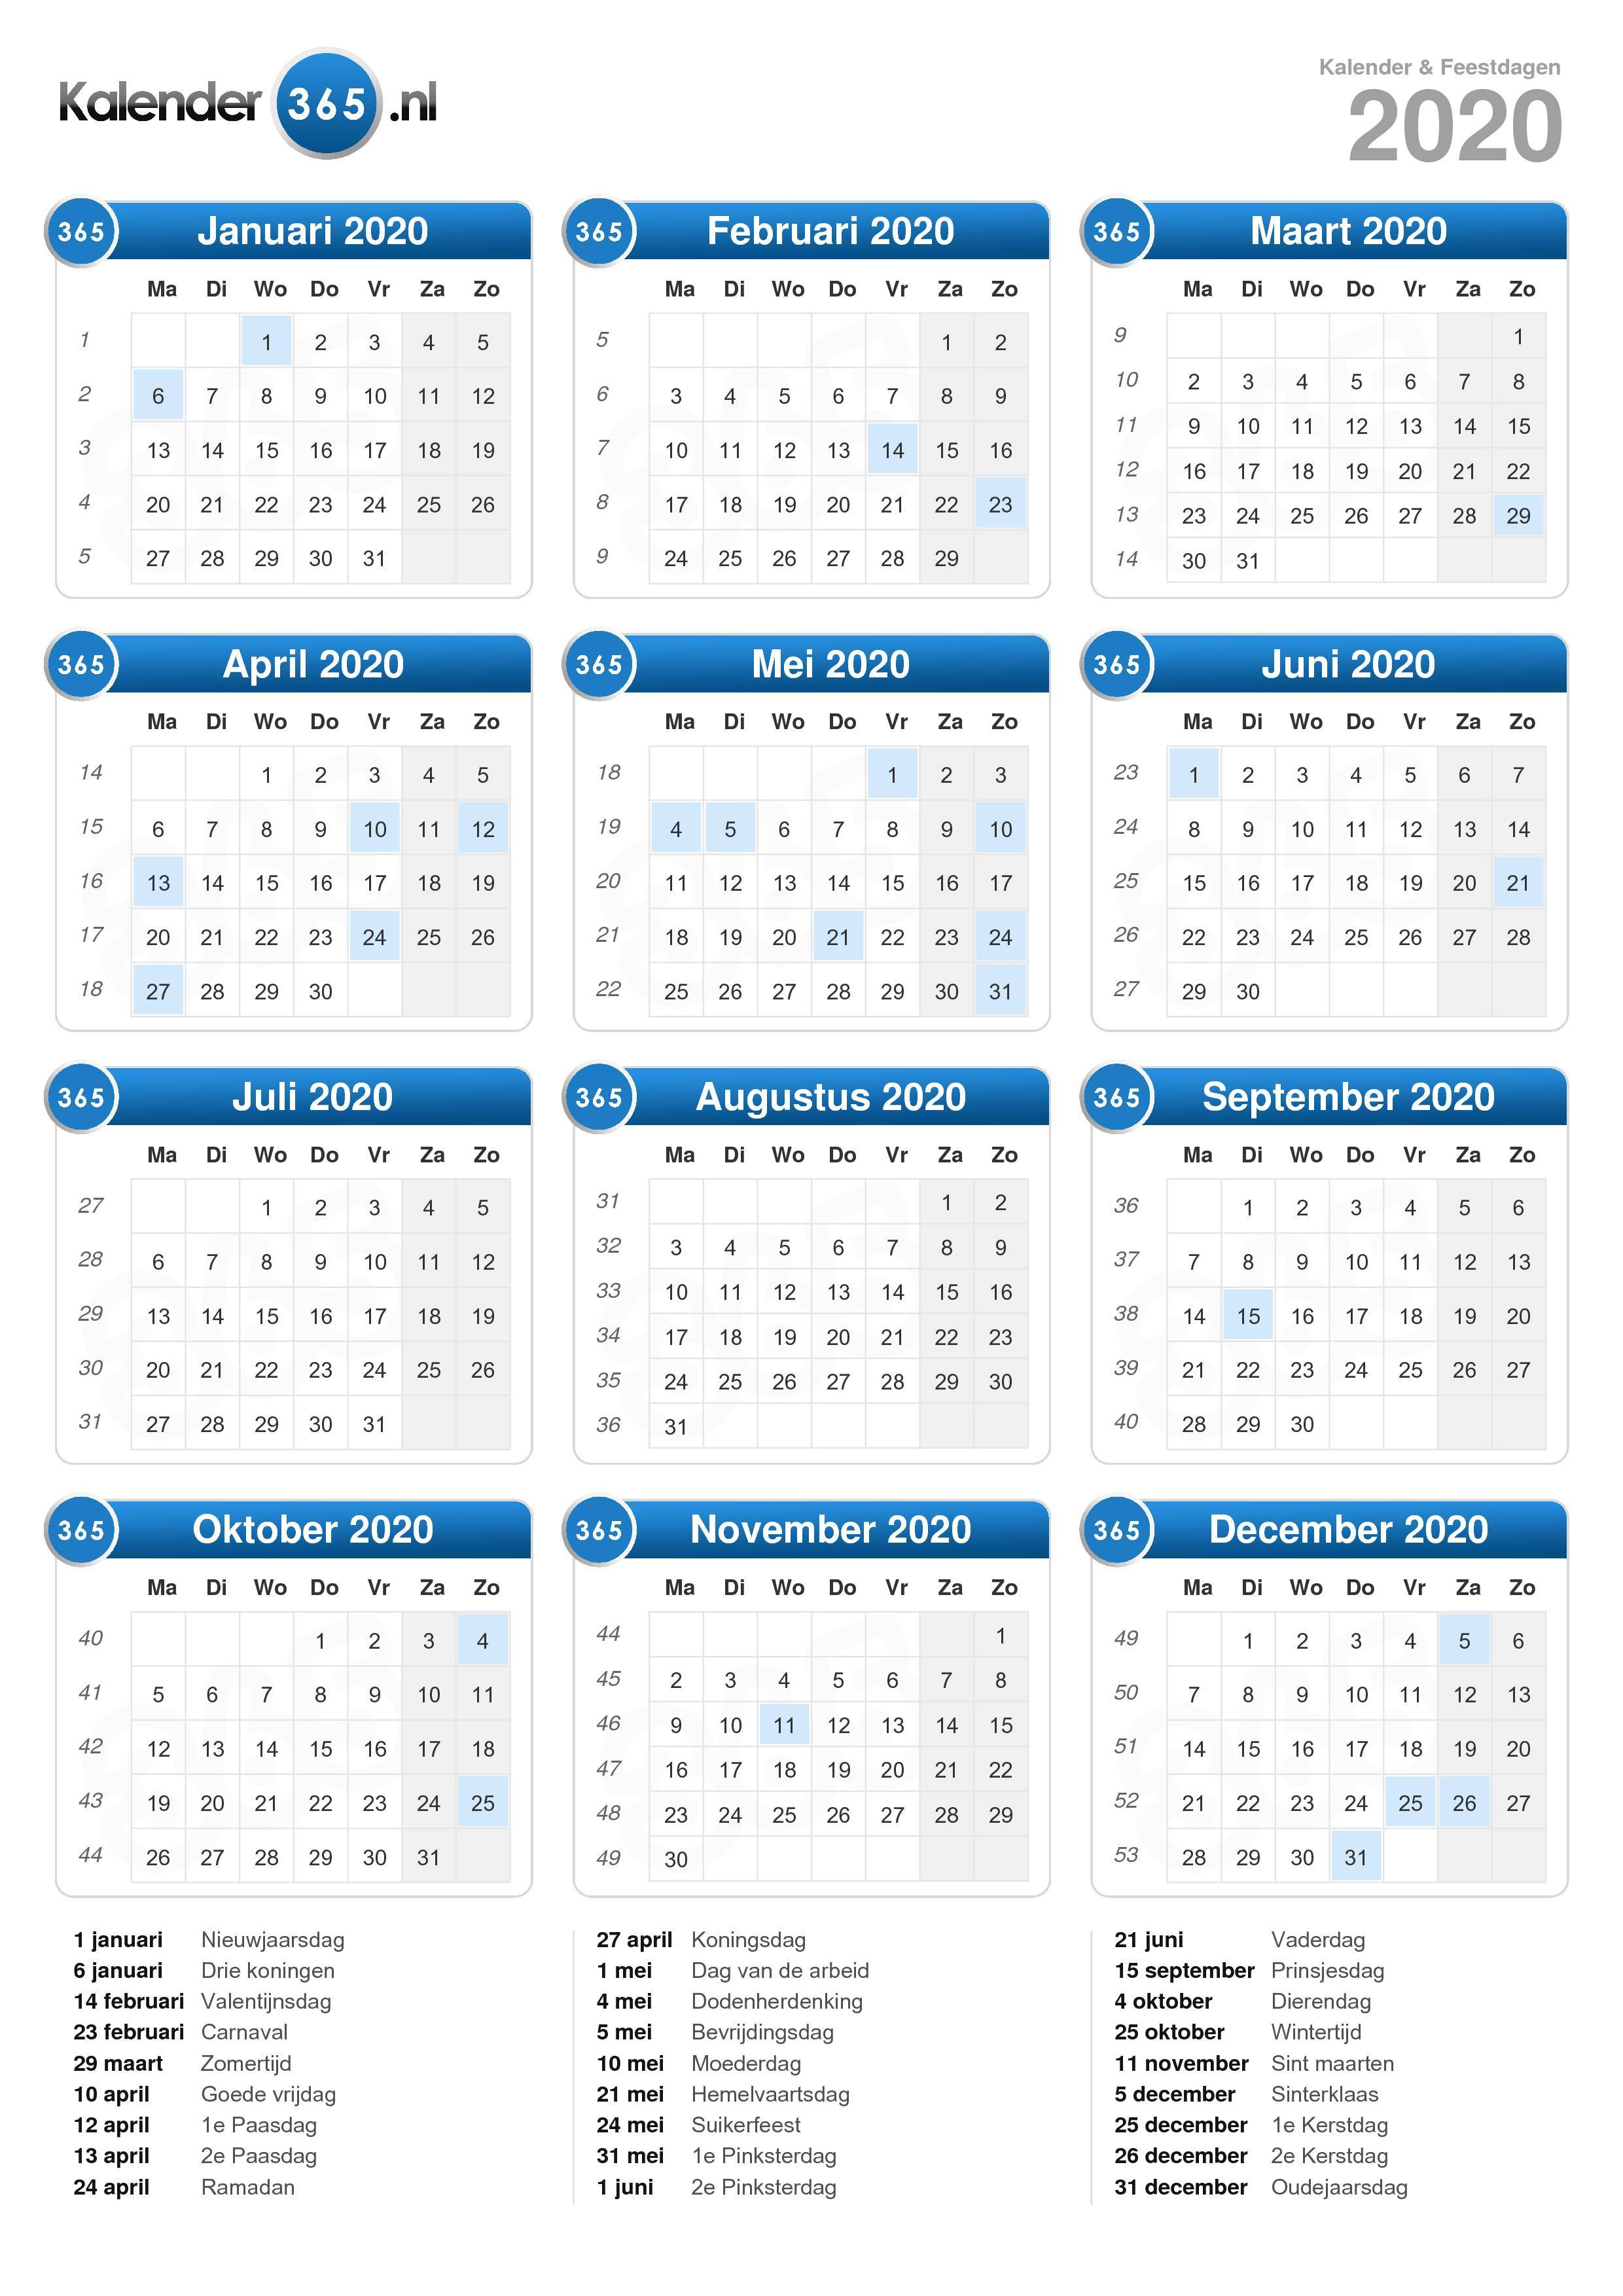
| Week number | From Date | To Date |
|---|---|---|
| Week 52, 2019 | December 23, 2019 | December 29, 2019 |
| Week 01 | December 30, 2019 | January 5, 2020 |
| Week 02 | January 6, 2020 | January 12, 2020 |
| Week 03 | January 13, 2020 | January 19, 2020 |
| Week 04 | January 20, 2020 | January 26, 2020 |
| Week 05 | January 27, 2020 | February 2, 2020 |
| Week 06 | February 3, 2020 | February 9, 2020 |
| Week 07 | February 10, 2020 | February 16, 2020 |
| Week 08 | February 17, 2020 | February 23, 2020 |
| Week 09 | February 24, 2020 | March 1, 2020 |
| Week 10 | March 2, 2020 | March 8, 2020 |
| Week 11 | March 9, 2020 | March 15, 2020 |
| Week 12 | March 16, 2020 | March 22, 2020 |
| Week 13 | March 23, 2020 | March 29, 2020 |
| Week 14 | March 30, 2020 | April 5, 2020 |
| Week 15 | April 6, 2020 | April 12, 2020 |
| Week 16 | April 13, 2020 | April 19, 2020 |
| Week 17 | April 20, 2020 | April 26, 2020 |
| Week 18 | April 27, 2020 | May 3, 2020 |
| Week 19 | May 4, 2020 | May 10, 2020 |
| Week 20 | May 11, 2020 | May 17, 2020 |
| Week 21 | May 18, 2020 | May 24, 2020 |
| Week 22 | May 25, 2020 | May 31, 2020 |
| Week 23 | June 1, 2020 | June 7, 2020 |
| Week 24 | June 8, 2020 | June 14, 2020 |
| Week 25 | June 15, 2020 | June 21, 2020 |
| Week 26 | June 22, 2020 | June 28, 2020 |
| Week 27 | June 29, 2020 | July 5, 2020 |
| Week 28 | July 6, 2020 | July 12, 2020 |
| Week 29 | July 13, 2020 | July 19, 2020 |
| Week 30 | July 20, 2020 | July 26, 2020 |
| Week 31 | July 27, 2020 | August 2, 2020 |
| Week 32 | August 3, 2020 | August 9, 2020 |
| Week 33 | August 10, 2020 | August 16, 2020 |
| Week 34 | August 17, 2020 | August 23, 2020 |
| Week 35 | August 24, 2020 | August 30, 2020 |
| Week 36 | August 31, 2020 | September 6, 2020 |
| Week 37 | September 7, 2020 | September 13, 2020 |
| Week 38 | September 14, 2020 | September 20, 2020 |
| Week 39 | September 21, 2020 | September 27, 2020 |
| Week 40 | September 28, 2020 | October 4, 2020 |
| Week 41 | October 5, 2020 | October 11, 2020 |
| Week 42 | October 12, 2020 | October 18, 2020 |
| Week 43 | October 19, 2020 | October 25, 2020 |
| Week 44 | October 26, 2020 | November 1, 2020 |
| Week 45 | November 2, 2020 | November 8, 2020 |
| Week 46 | November 9, 2020 | November 15, 2020 |
| Week 47 | November 16, 2020 | November 22, 2020 |
| Week 48 | November 23, 2020 | November 29, 2020 |
| Week 49 | November 30, 2020 | December 6, 2020 |
| Week 50 | December 7, 2020 | December 13, 2020 |
| Week 51 | December 14, 2020 | December 20, 2020 |
| Week 52 | December 21, 2020 | December 27, 2020 |
| Week 53 | December 28, 2020 | January 3, 2021 |
| Week 01, 2021 | January 4, 2021 | January 10, 2021 |
Bitcoin Market Health
Week 38 begins on Monday, 20 September 2021. Check the current week number and convert between dates and week numbers on Weeknumber.co.uk. Calendar Planner For Week 38 In 2020, Ends September 20 – 15823 Broadcast Calendars Rab – 15826 Now you’ve got sufficient reasons to make a calendar on your own. The calendar is.
Bitcoin started to recover in Week 38, beginning the week at $10,340 and ending it at $10,900. BTC briefly moved above $11k on Wednesday and Saturday, but failed to find support at this level, falling back down into the high $10,000s. As of Monday morning, however, BTC has fallen to $10,450 as crypto markets drop along with the stock market.
Bitcoin on-chain fundamentals increased over Week 38 after losing ground the previous week. GNI saw a 5 point increase, taking it back up to a score of 60 points. This increase was due to gains across all three subindices: Network Health, Liquidity, and Sentiment.

Network Healthgained 9 points during Week 38, ending up at 74 points. Network growth saw a 16% increase as more bitcoin addresses were created, while network activity also grew due to a rise in the number of on-chain BTC transactions.
Liquiditysaw a 2 point increase over the week, bringing it to a score of 55 points. Both the trading liquidity and transaction liquidity subcategories saw modest increases as a result of an increase in stablecoin supply and on-chain transaction count.
Sentimentincreased by 4 points, due to spikes in both the investor sentiment and saving behavior subcategories. Investor sentiment rose due to the slight BTC price increase throughout the week, which saw more UTXOs move into a profitable state. Meanwhile, the rate at which hodlers acquired BTC also increased, bumping up the saving behavior subcategory.

Glassnode Compass
The compass moved further into safer territory during Week 38, seeing increases in both GNI and price trend. This represents the 17th consecutive week that BTC remains in the bullish Regime 1 quadrant.
However, while BTC performed well during Week 38, Monday morning's events threaten to pull the price back down. This morning, Bitcoin fell to $10,450, seeing large losses along with the rest of the crypto market. This drop was almost certainly caused by a sharp drop in stock market futures.


Throughout 2020, we have consistently seen a strong correlation between crypto markets and traditional financial markets, and the crypto market's response to the 2.2% drop in Dow Jones futures this morning has reaffirmed this correlation.
As such, while the BTC price does appear to be stabilizing later into the day, investors should keep an eye on stock market movements to see whether they should prepare for a further drop in prices.
Altcoin Digest
Performance against BTC
In Week 38, BTC saw strong performance against the rest of the crypto market; every major altcoin lost value next to BTC over the week. In its continued slide, LINK lost 22.7% of its value against BTC, while ETH fared better at only -3.9%.
Meanwhile, Bitcoin SV has slipped out of the top 10 altcoins thanks to the release of DOT and the increase in value of Crypto.com coin (CRO).

Performance against USD
The top coins had mixed performance against USD over the past week. BCH, XRP, and BCH all increased slightly in dollar value, while LTC, DOT, and LINK lost value.
BTC gained ground once again, increasing its market dominance back to 58.3%, up from 56.6% the previous week.
Which altcoins would you like to see us cover in future editions of The Week On-Chain? Let us know on Twitter.
ETH Continues to Flow Out of Centralized Exchanges and Into Smart Contracts
Timeshare Week 38 2020
As innovation in DeFi continues at a rapid pace, more and more ETH are flowing out of exchanges and into smart contracts.
Met Opera Week 38 2020
Since 15 August, the balance of ETH on centralized exchanges has decreased by 11.6%, with 2.2 million ETH being withdrawn on net. Meanwhile, the amount of ETH in smart contracts has increased by 3.4 million ETH.
This means that not only is ETH being withdrawn from exchanges and moved into the DeFi ecosystem, but it is also moving from private wallets into smart contracts. Right now, the DeFi ecosystem has 8 million ETH locked up, in comparison with the 16.6 million ETH on centralized exchanges - and this figure is continually growing.
At the same time, ETH volume on centralized exchanges is stagnating while DEX volumes continue to increase as the ecosystem matures and moves increasingly toward on-chain transactions.
Week 38 2020 Rsk Papers
- Follow us and reach out on Twitter
- Join our Telegram channel
- For on–chain metrics and activity graphs, visit Glassnode Studio
- For automated alerts on core on–chain metrics and activity on exchanges, visit our Glassnode Alerts Twitter
Calendar Week 38 2020
Disclaimer: This report does not provide any investment advice. All data is provided for information purposes only. No investment decision shall be based on the information provided here and you are solely responsible for your own investment decisions.
